Two point clouds. One view of the roof.
View a drone photogrammetry cloud alongside an open-data LiDAR point cloud from the Bavarian Surveying Administration, with ALKIS cadastral maps and OpenStreetMap for context.
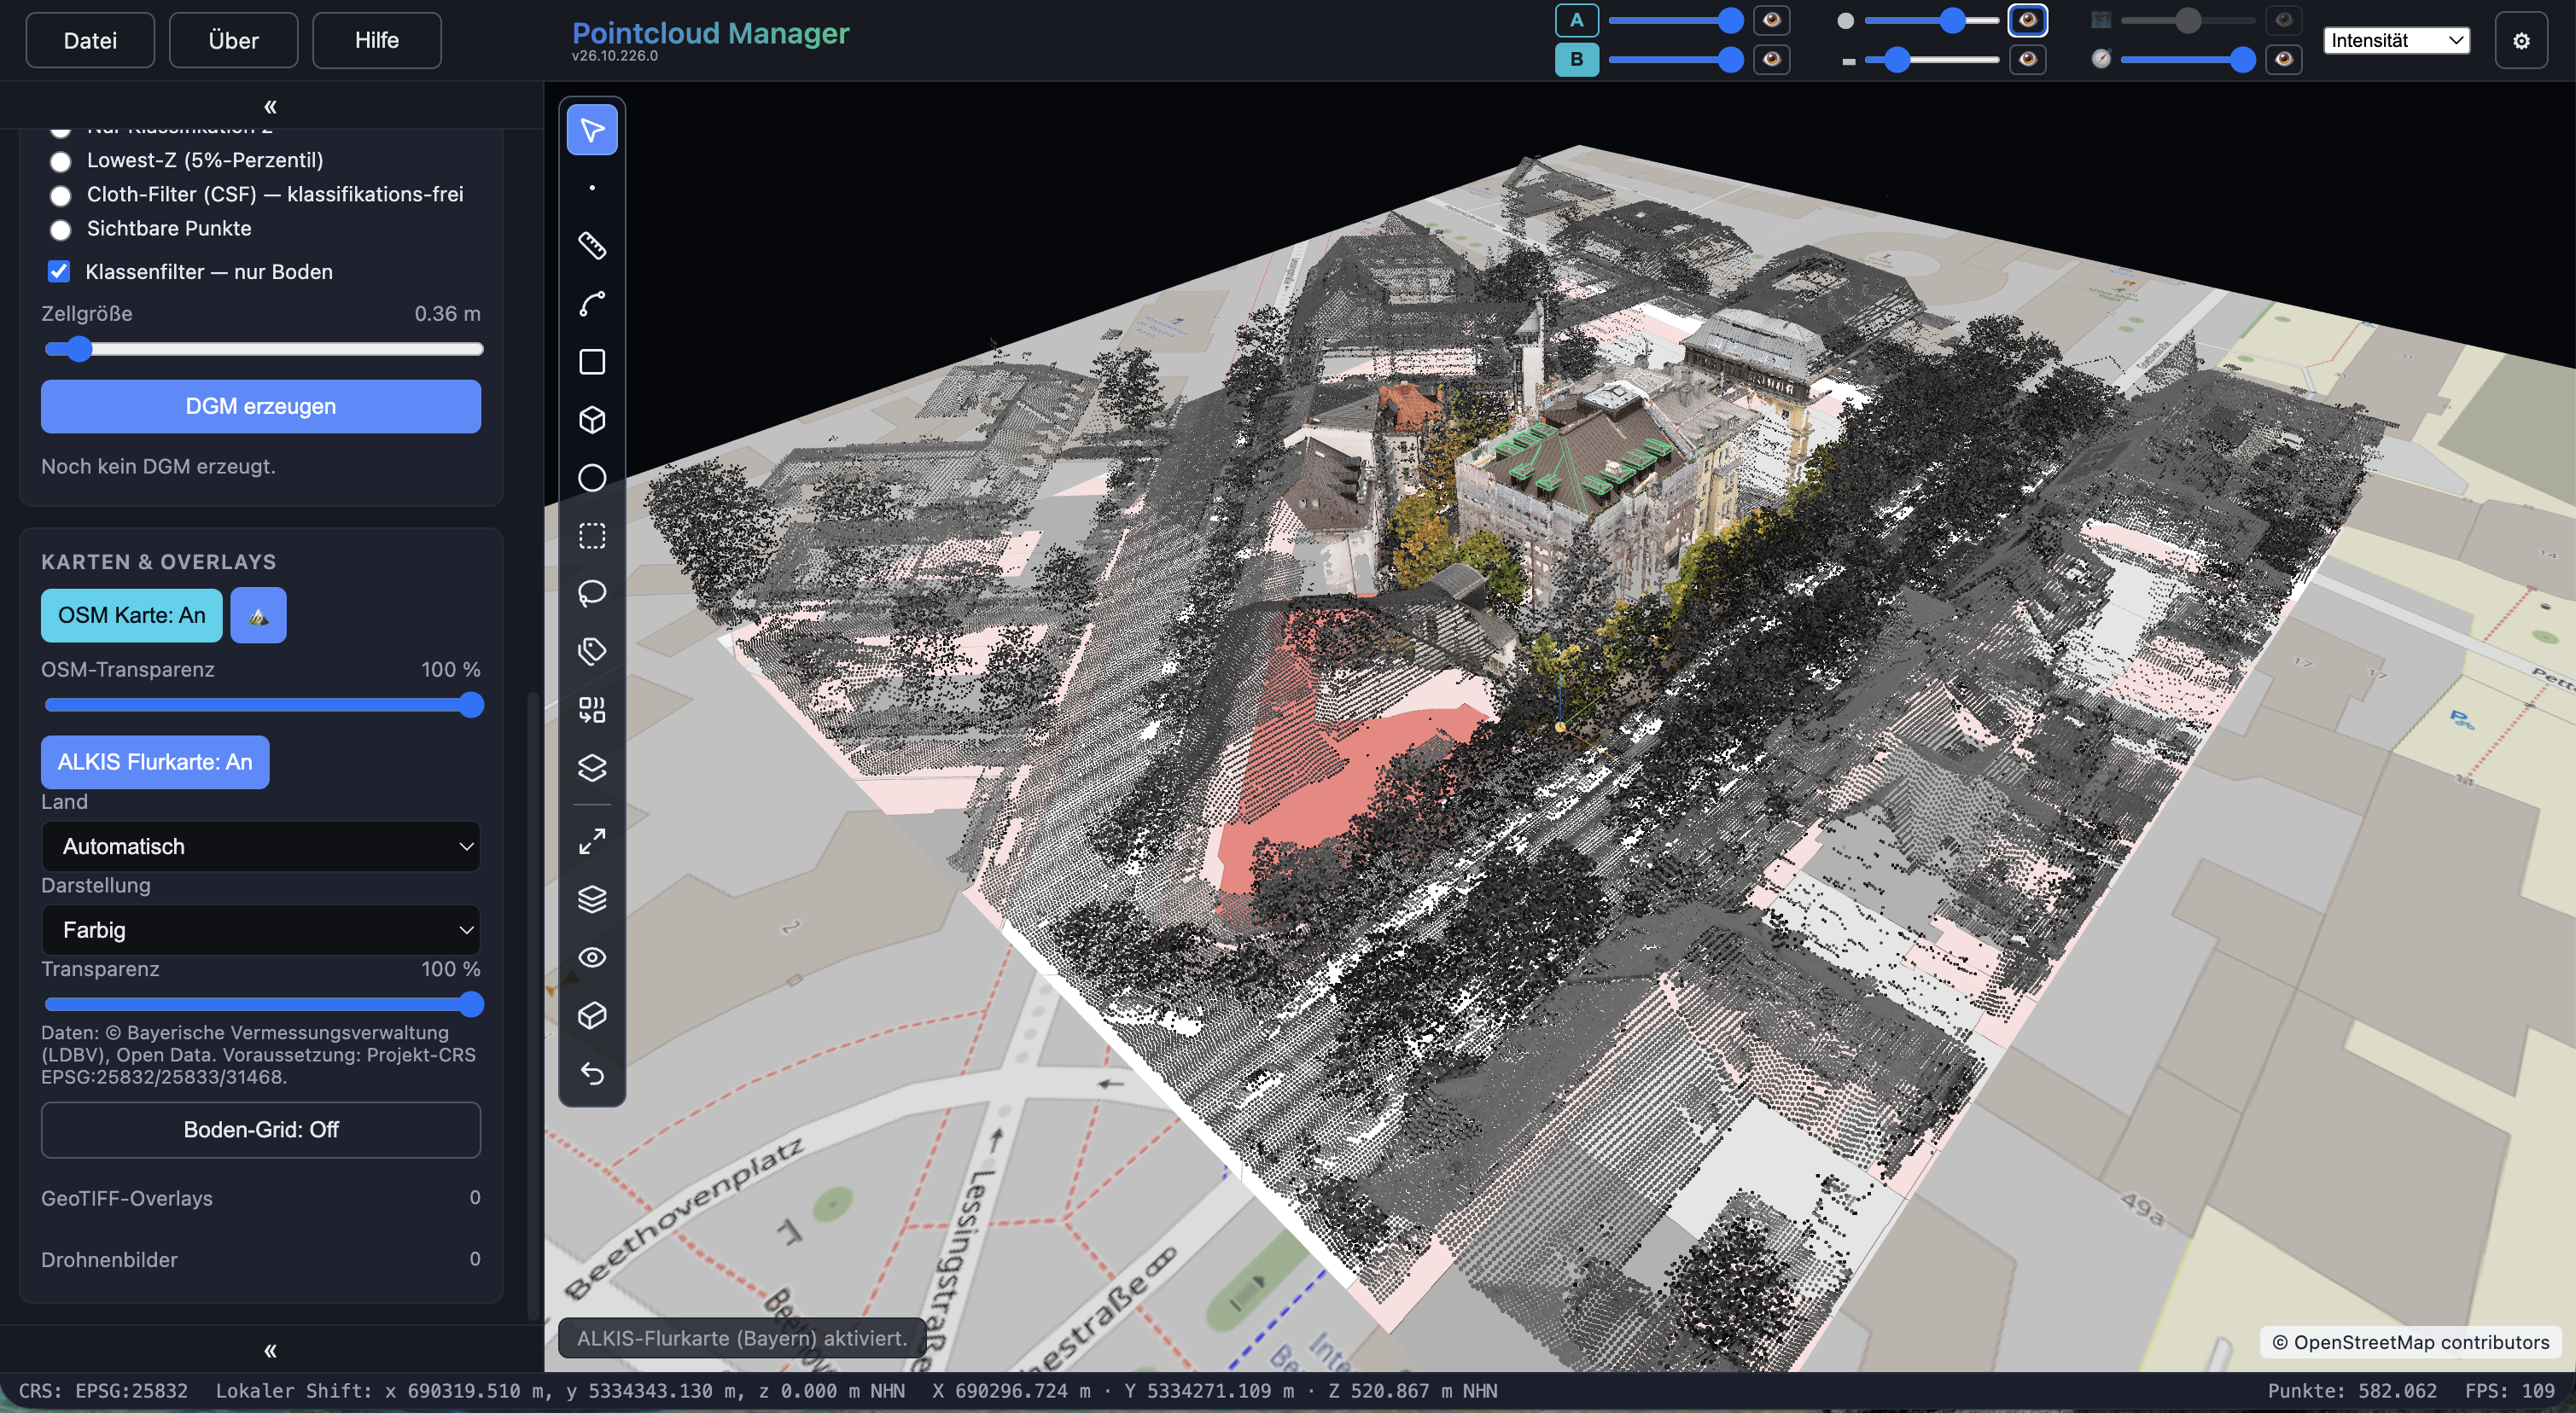
See your survey in its spatial context.
This roof surveying example centres on a point cloud generated from drone images. It shows the building and its roof structure. A second point cloud from the Bavarian Surveying Administration’s open-data service provides context.
Both datasets can be viewed together in one project, allowing the different surveys to be compared directly at the building.
Import open-data LiDAR directly.
The open-data LiDAR point cloud is loaded for the area directly in the application and displayed in a second slot. Both slots let you view your drone survey alongside the official LiDAR points and control their appearance separately.
The screenshot shows the two surveys overlaid in space. Green roof geometry is drawn over the central building.
The combined view illustrates the dataset comparison. By itself, it does not establish a particular survey accuracy or matching acquisition dates.
Display parcel boundaries, buildings and surroundings.
The ALKIS cadastral map displays parcel boundaries and building outlines, with OpenStreetMap as an additional background. This places the roof survey in the context of the parcel and surrounding buildings.
The combined working view brings together the detail of your own survey, official point data and map context.
Align with the roof edge from multiple angles.
Gizmo handles let you move an area vertex after placing it. Switching between top, oblique and close-up views reveals its position relative to the captured roof points. RGB and “X-ray” views complement each other.
The point cloud occludes parts of the area boundaries and the gizmo. This helps check whether the drawing follows the visible edge. Images 1–6 use Auto-Ortho. Image 7 adds an RGB overview. From image 8 onwards, the position is checked in 3D: press M for Macro to jump directly to the gizmo. In Auto-Ortho, the yellow plane handle lets you move the vertex in the XY plane while keeping its elevation unchanged.
Step by step on the roof.
14 views · Select an image and browse the full-size gallery.
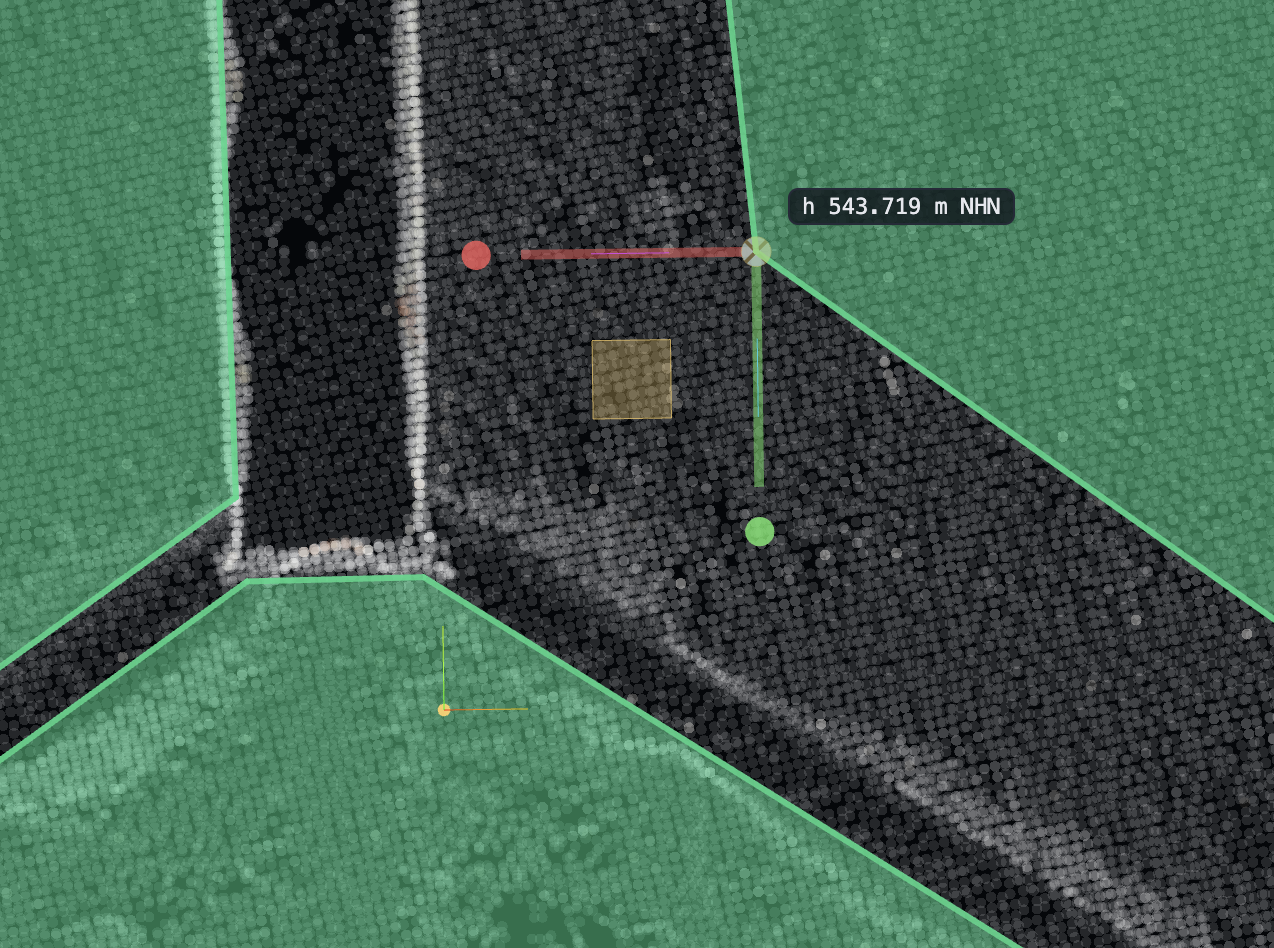
Auto-Ortho shows the selected area vertex relative to the edge. The “X-ray” display reveals the point structure.
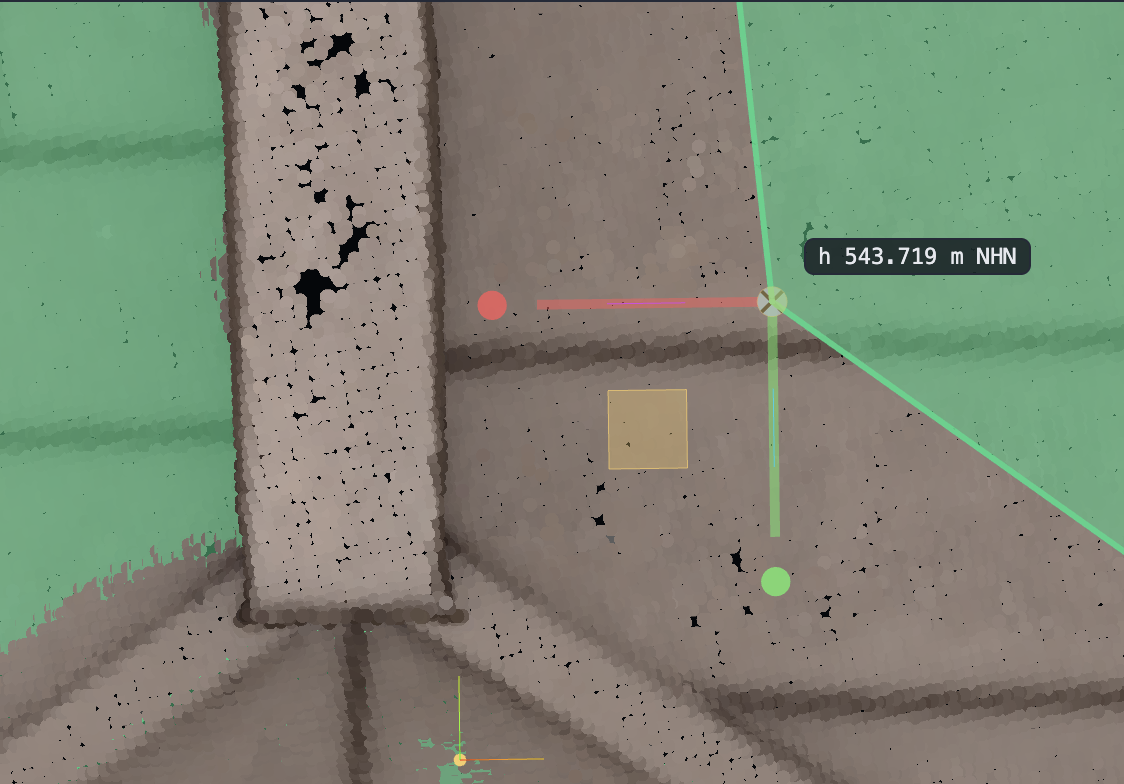
The RGB Auto-Ortho view shows the roof surface with the selected area vertex and its gizmo handles.
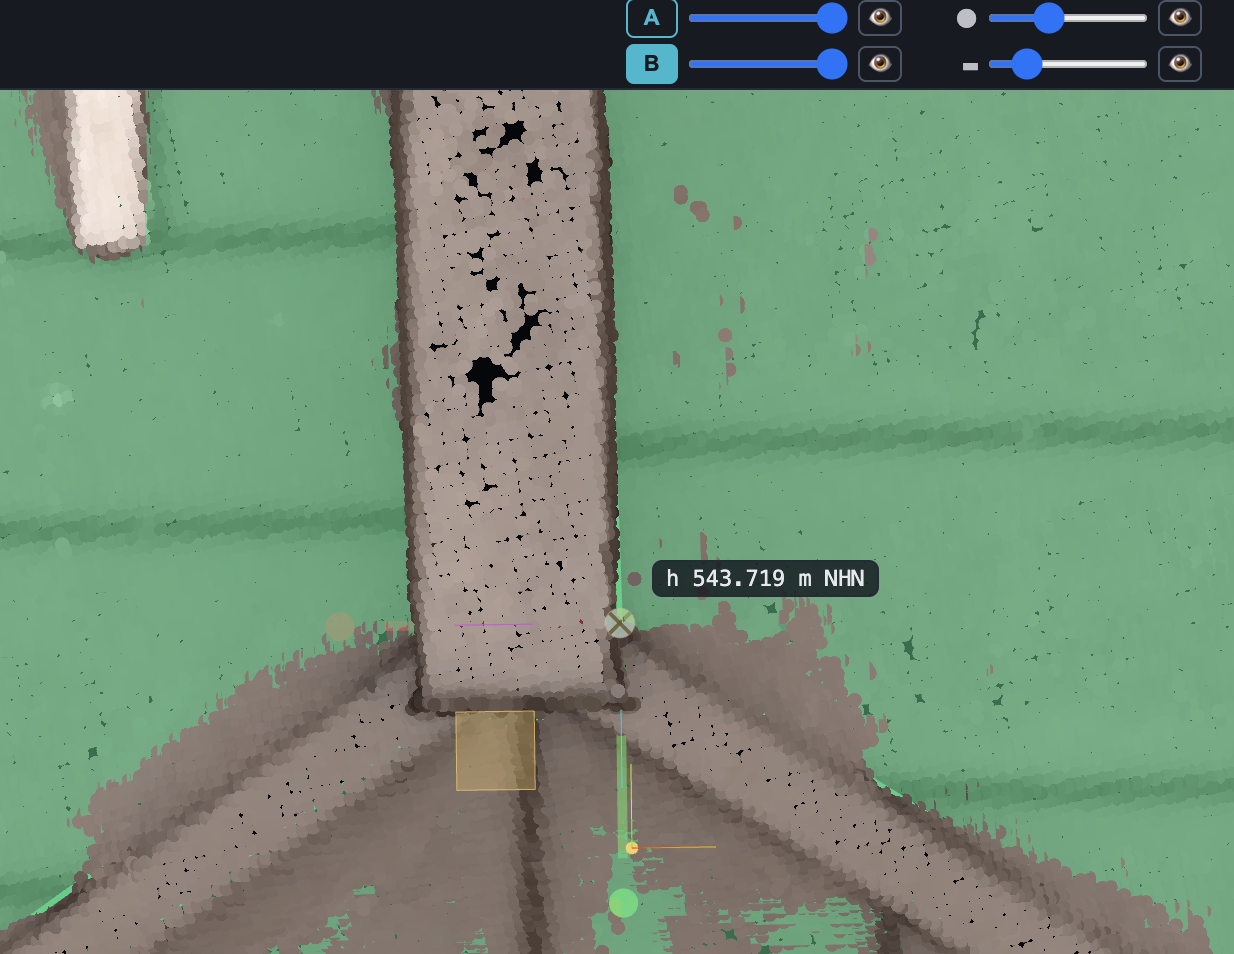
The yellow plane handle moves the vertex in the XY plane. This lets you adjust its position in Auto-Ortho without changing its elevation.
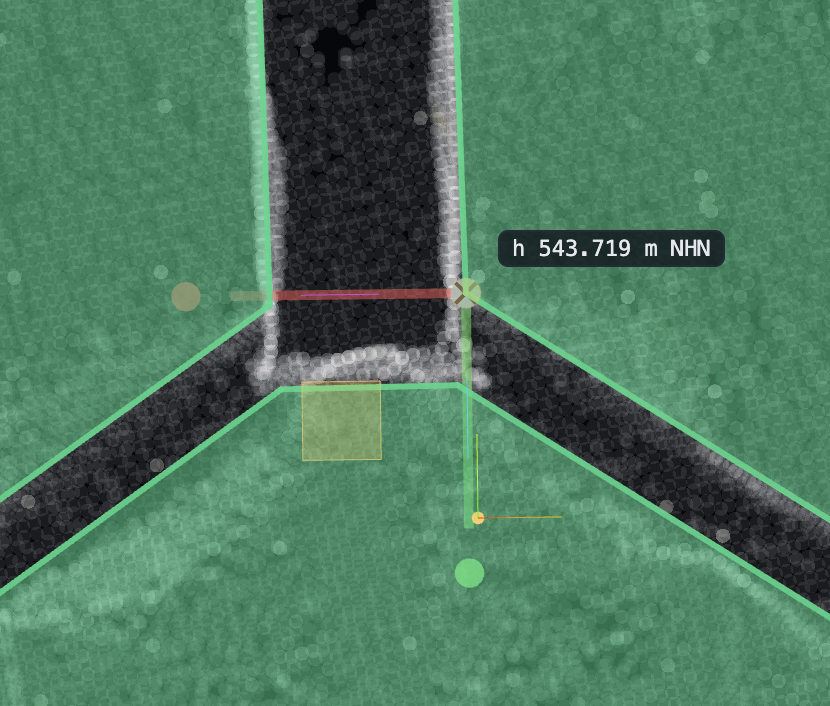
The Auto-Ortho “X-ray” display lets you follow the roof edges beneath the drawn areas.
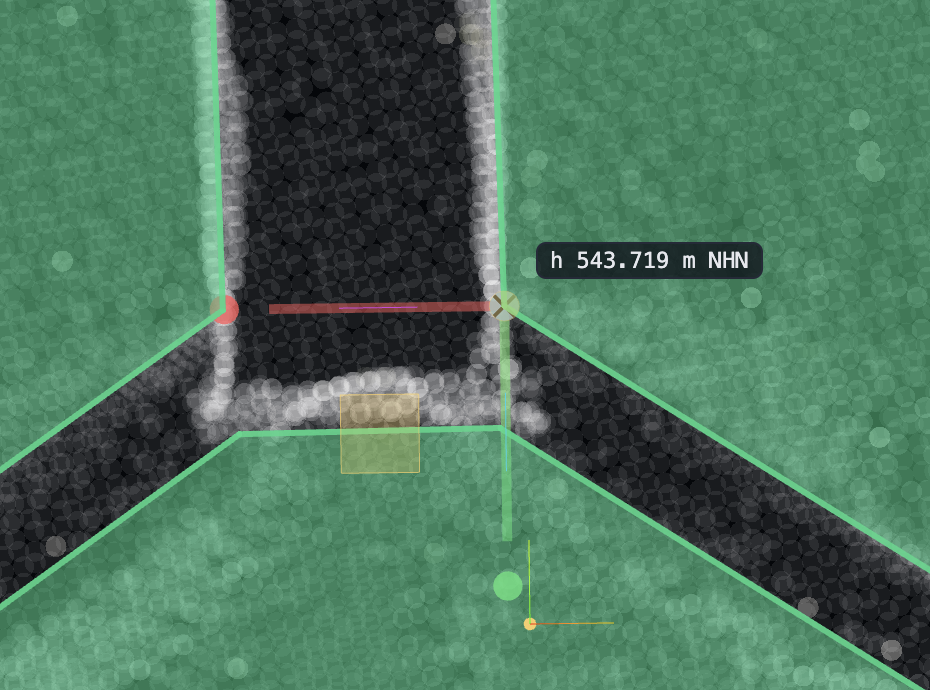
Use the yellow plane handle to fine-tune the vertex position in the XY plane. Its elevation stays unchanged.
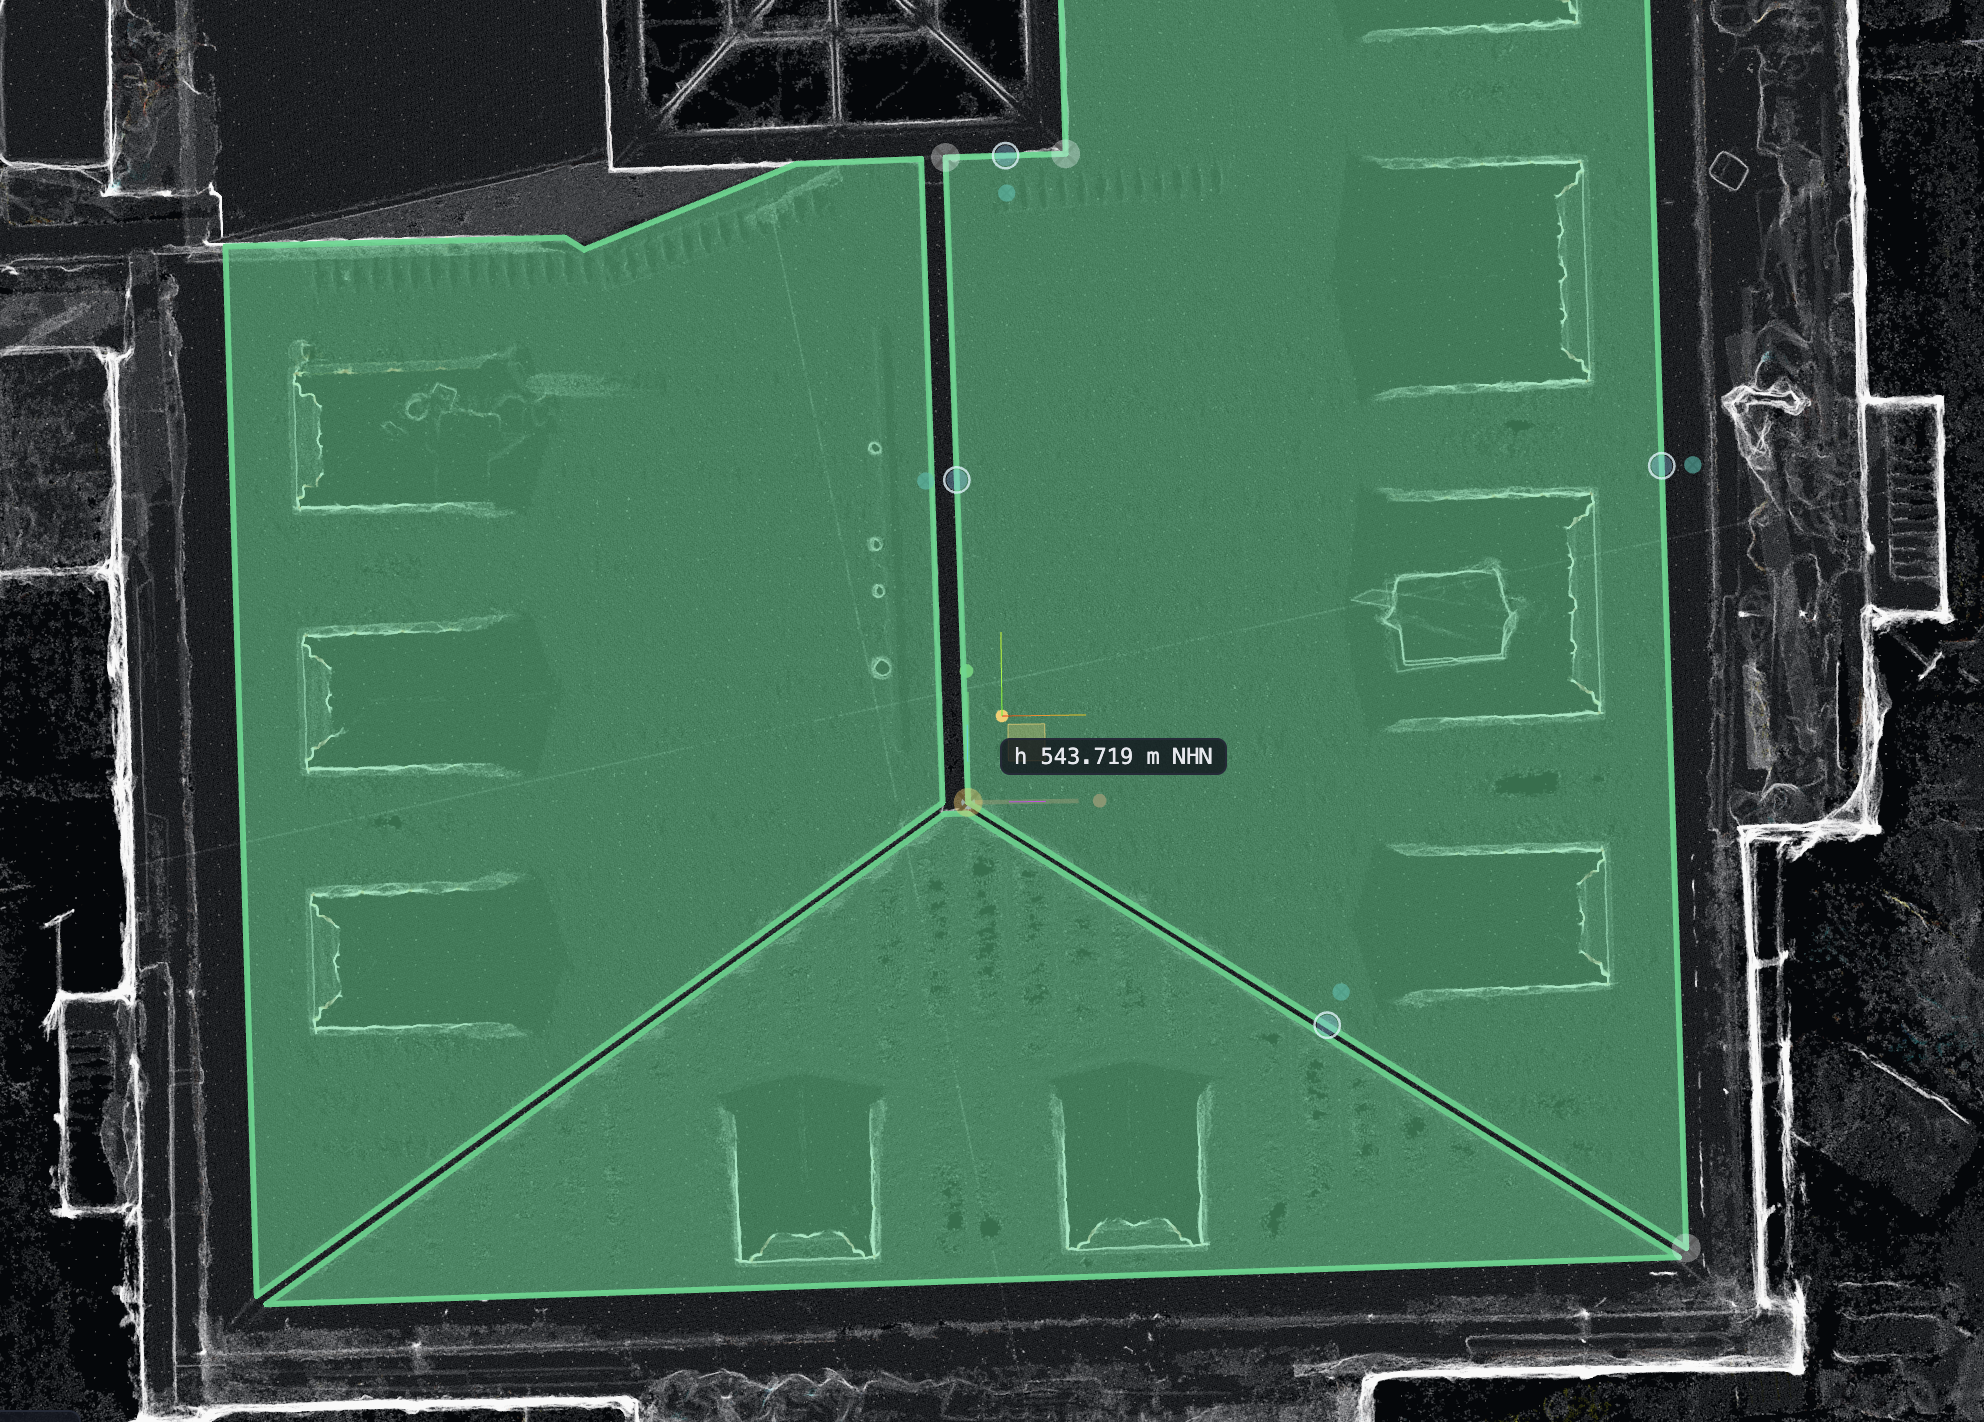
The Auto-Ortho “X-ray” overview shows the roof areas and their shared edges.
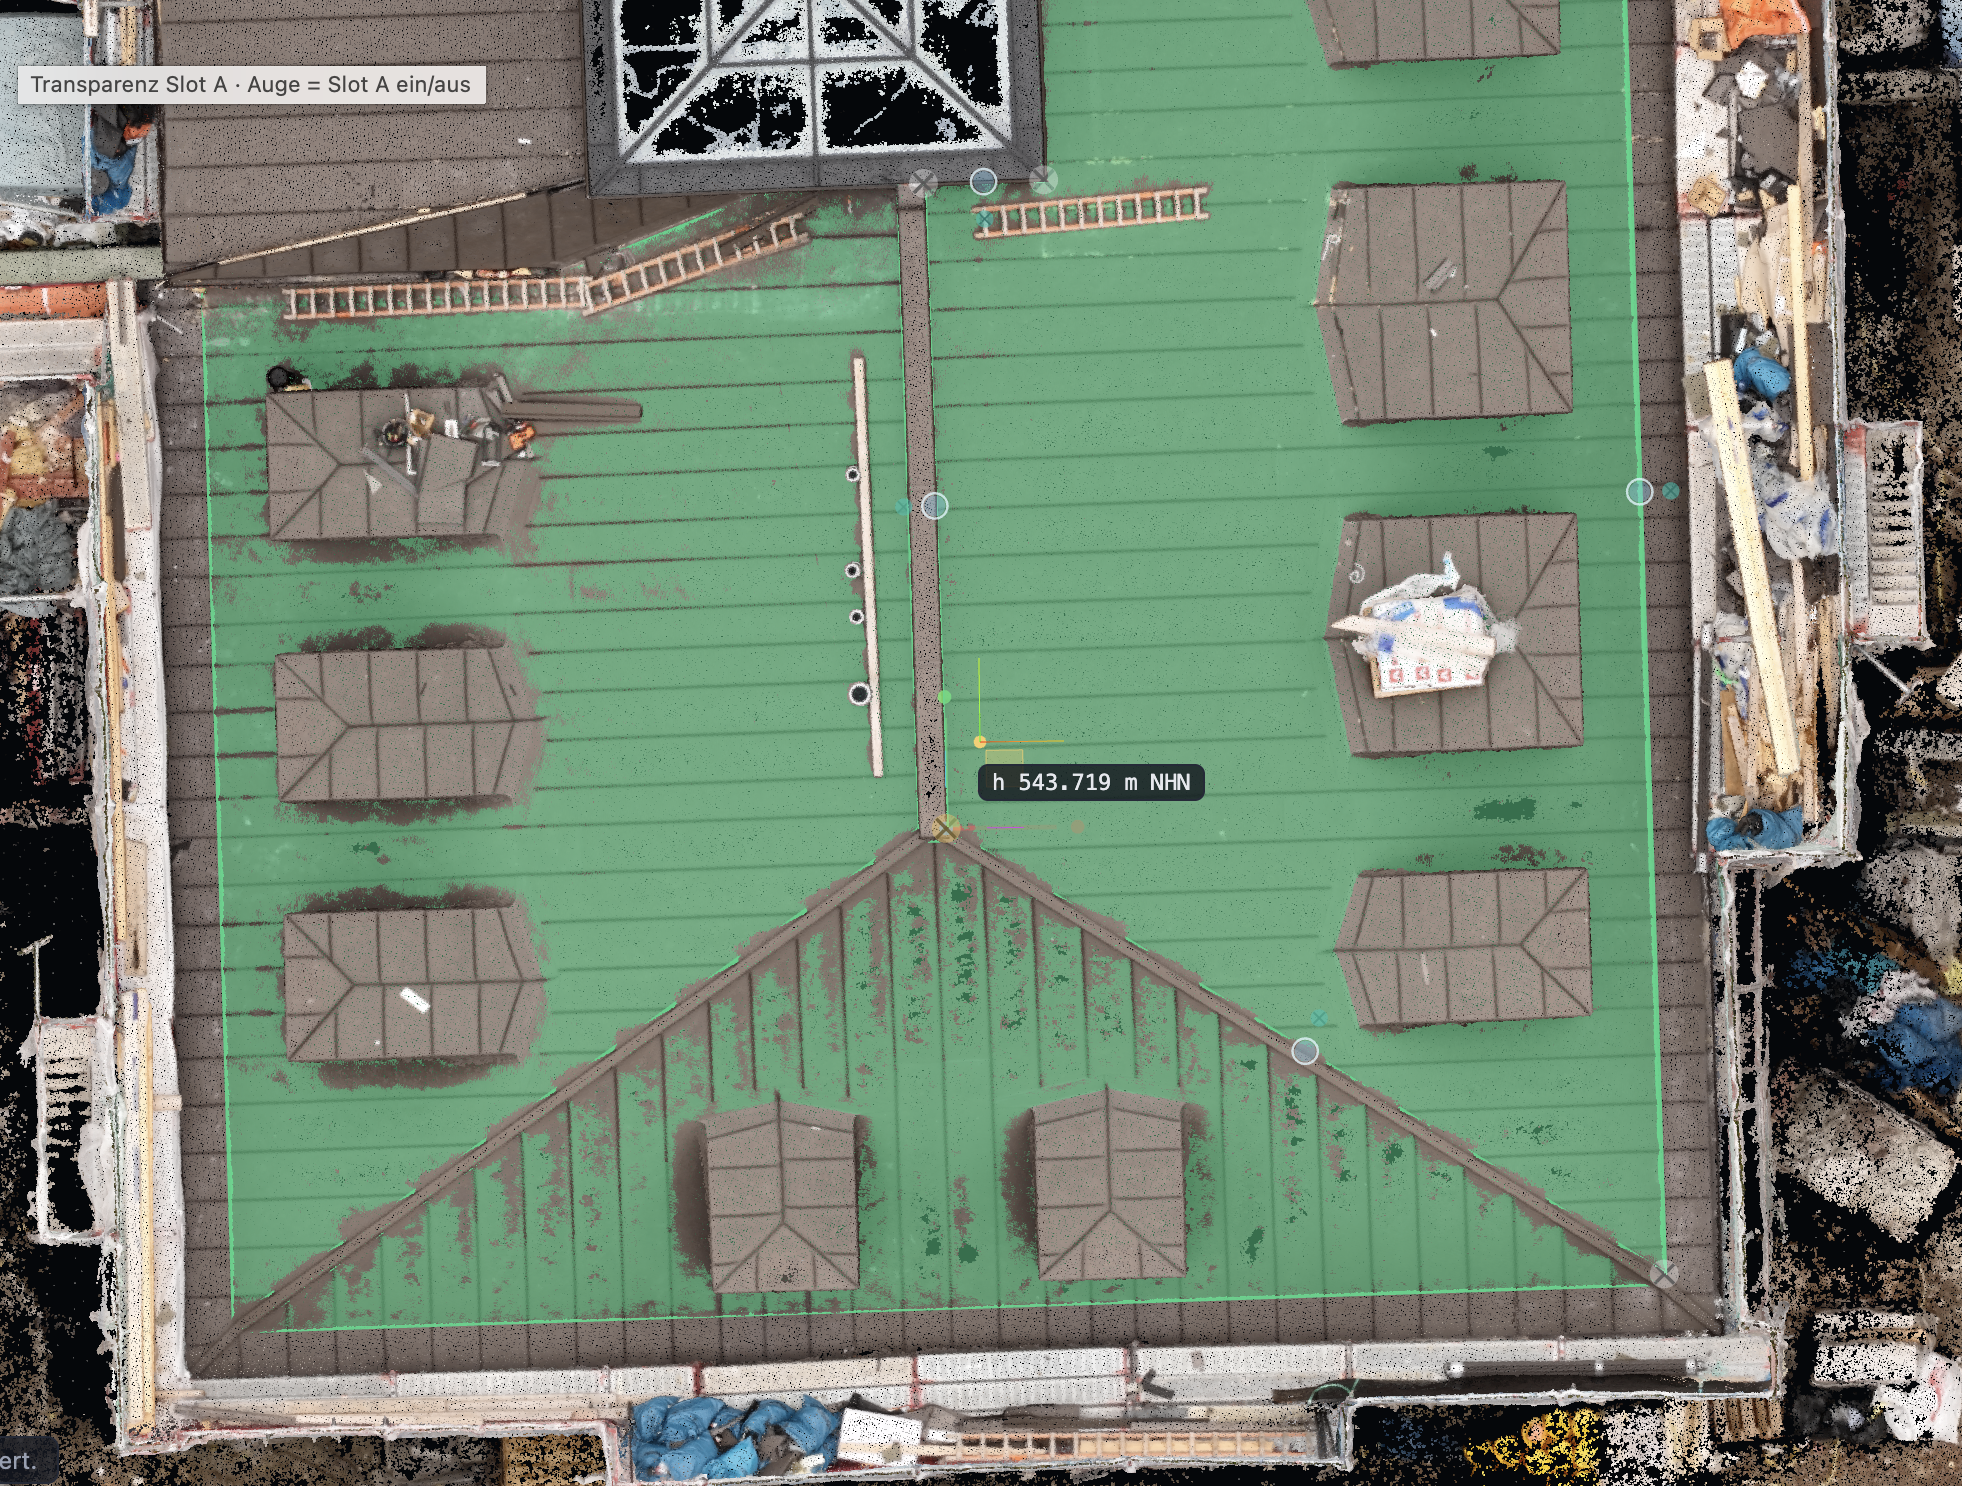
The RGB top view shows the areas alongside roof structures and the surrounding survey.
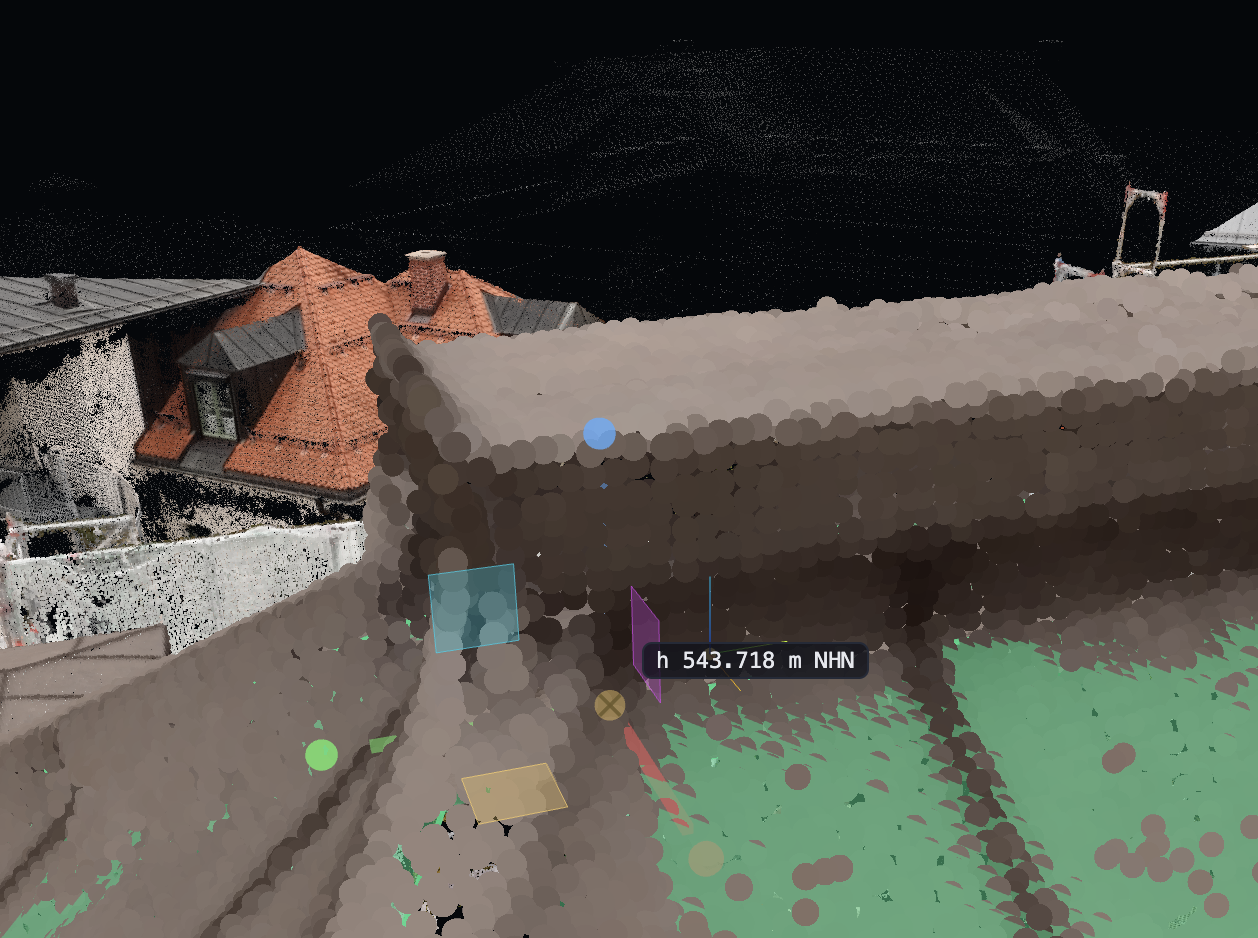
Press M for Macro to jump directly to the gizmo in 3D. Here the area vertex is still visibly off the intended edge and will be adjusted further.
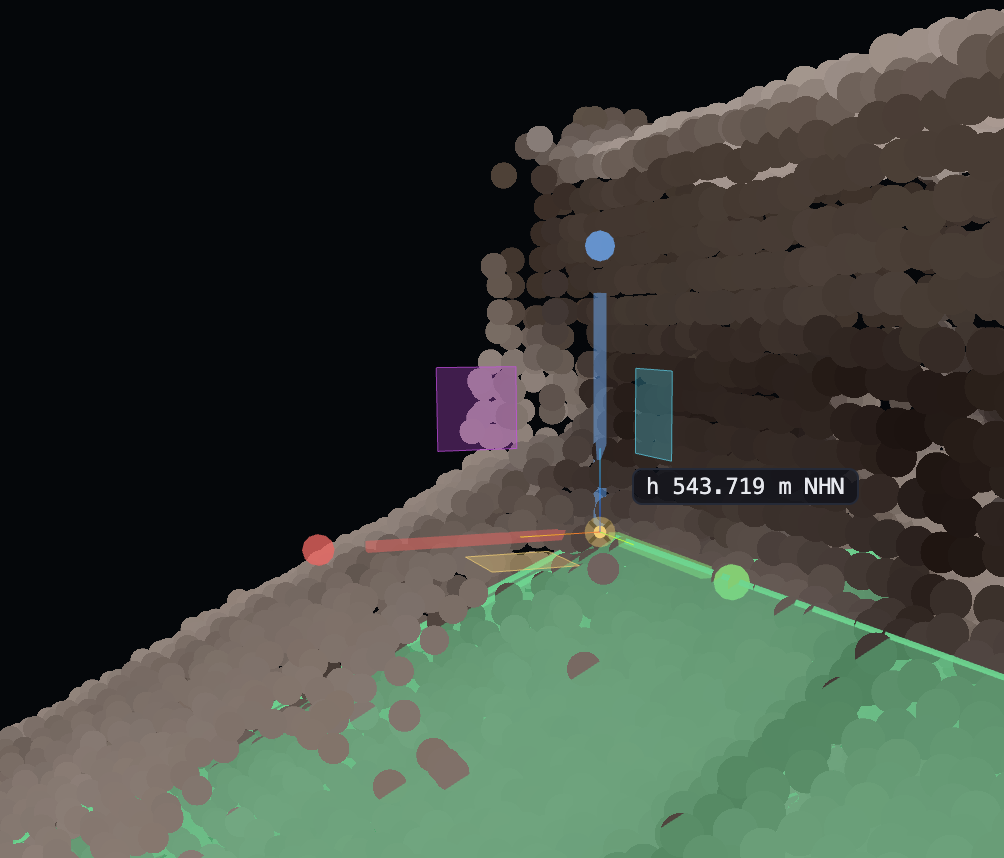
The side view reveals the spatial relationship between the area vertex and the captured roof points.
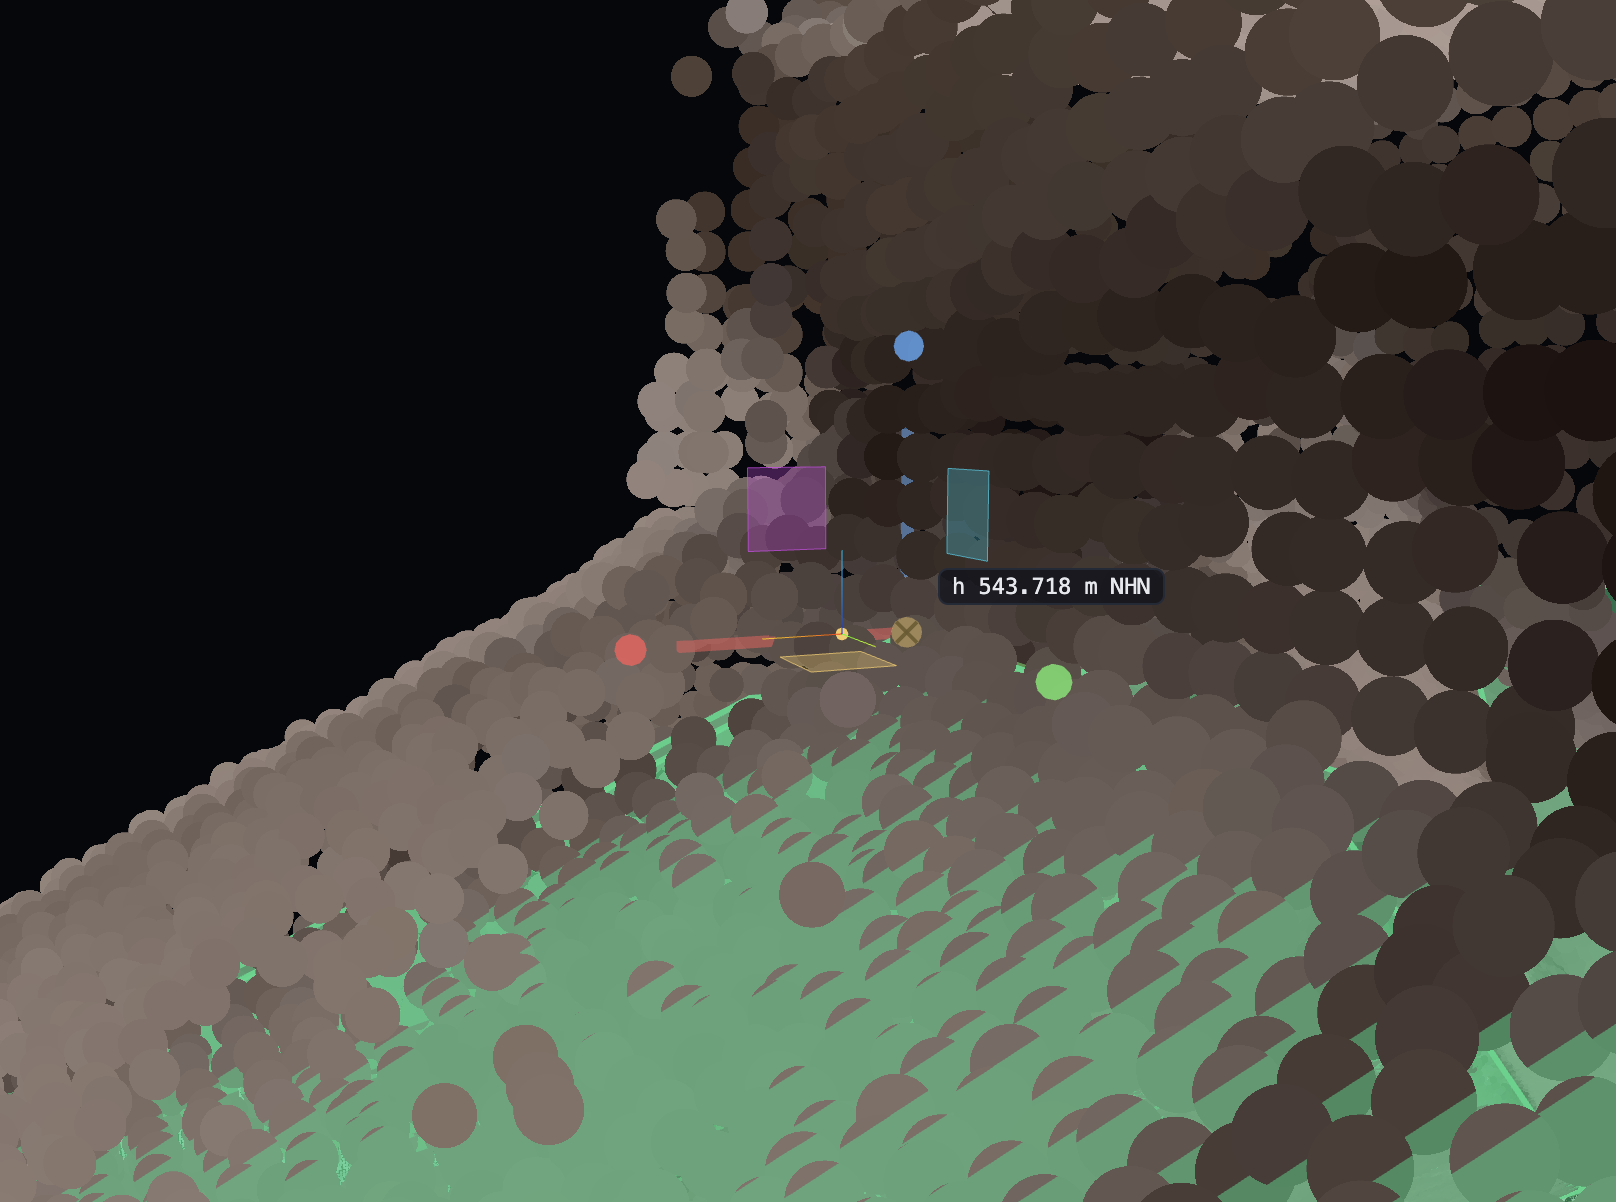
Another oblique view helps assess the vertex position and the adjoining area in their spatial context.
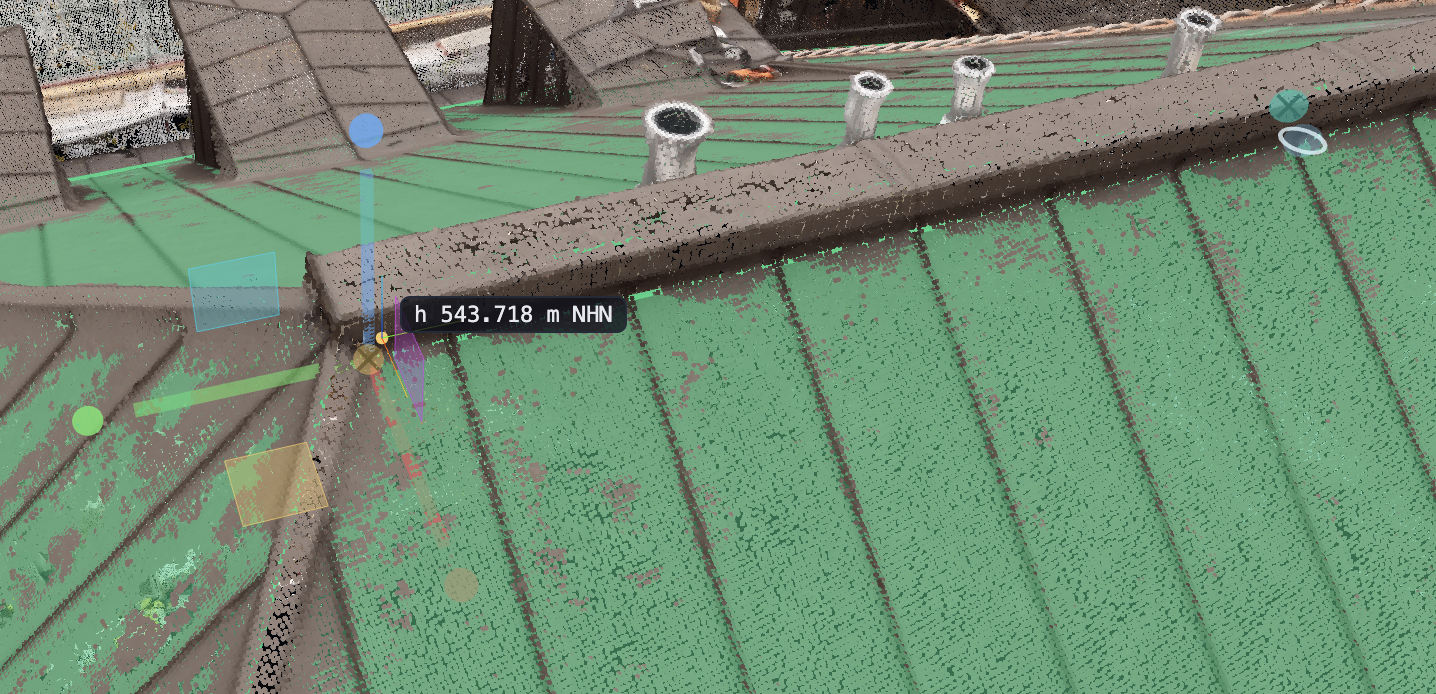
The overview shows the transparent roof area with the selected vertex and additional editing handles.
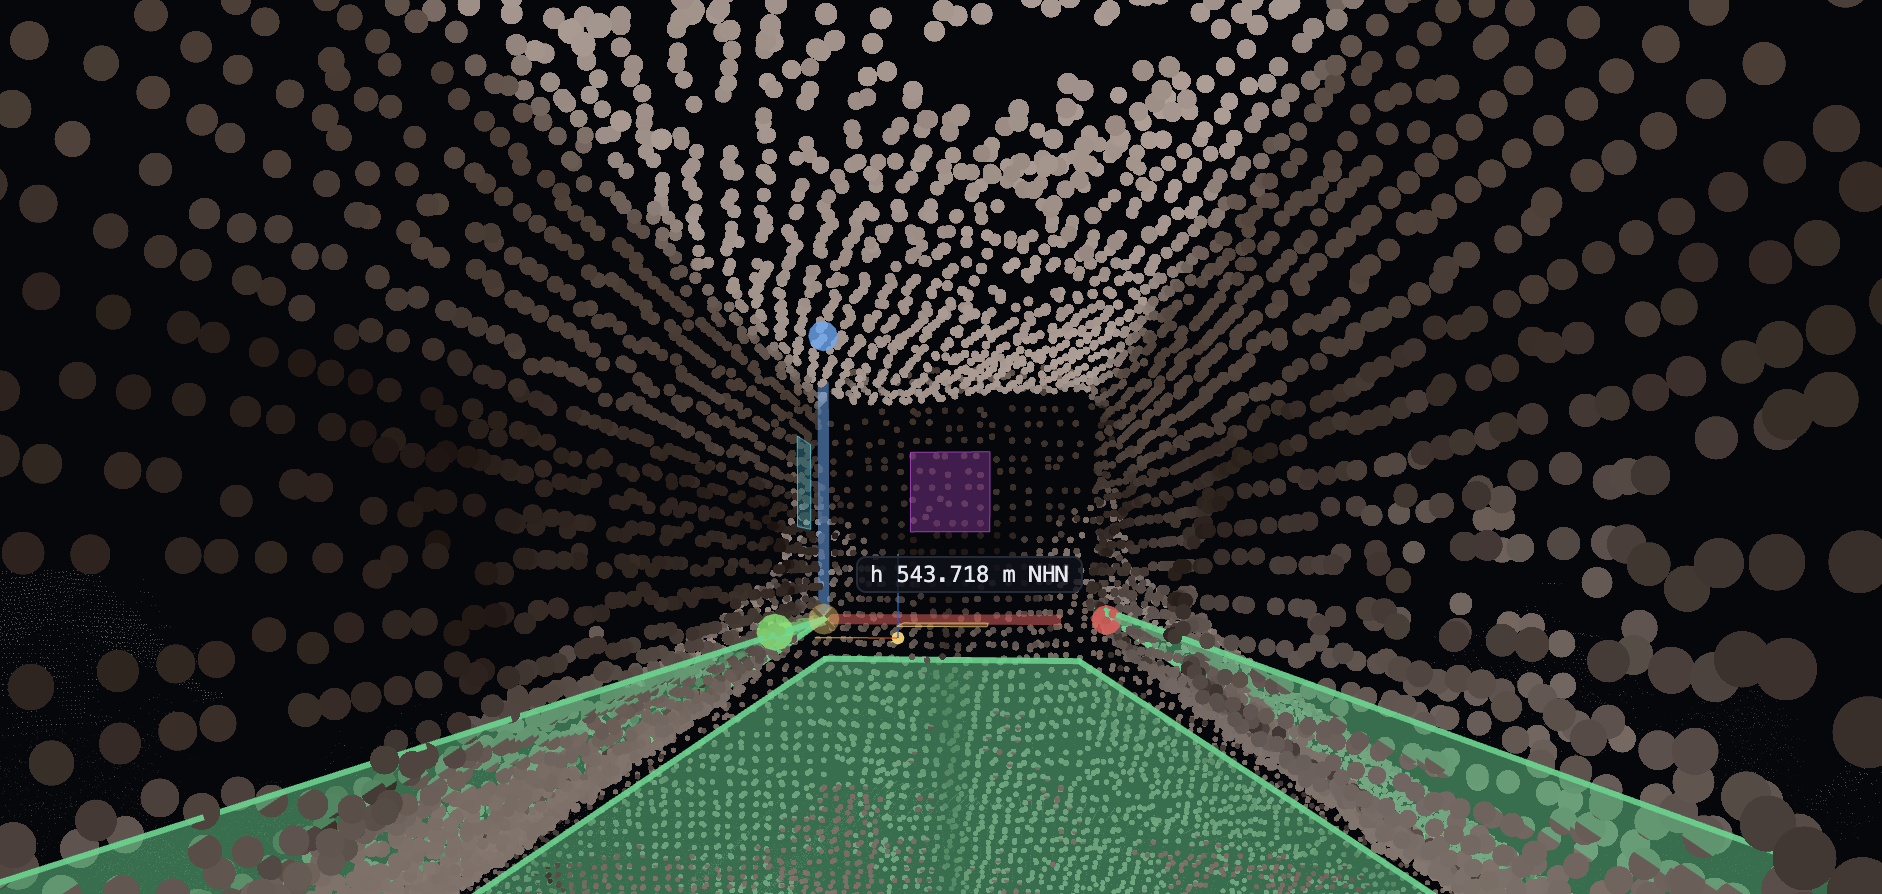
Cloud points occlude parts of the drawing and the gizmo. This helps you judge their position within the point cloud.

A dense point display shows the selected area vertex in relation to the surrounding surfaces.
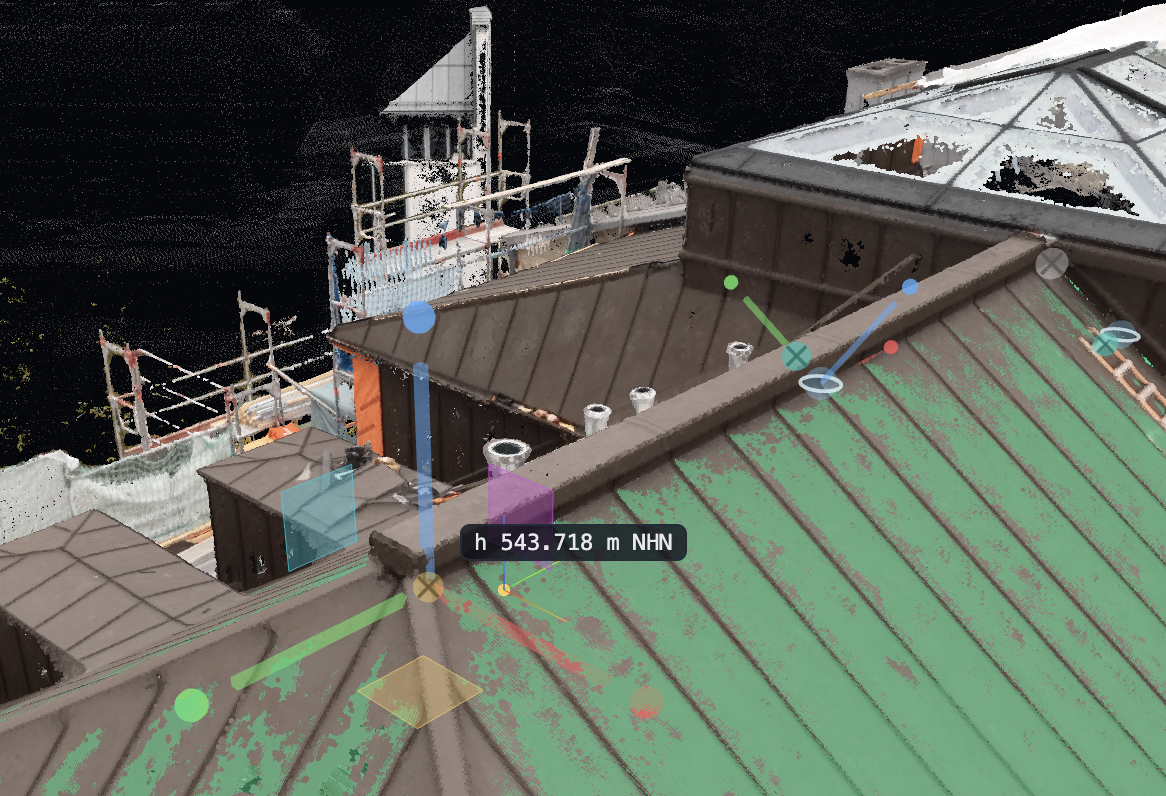
The final view shows the edited roof area in the context of the building.
View your own surveys in context.
Open your point cloud in Pointcloud Manager and explore the workflow with your own project data.
Try free for 14 days