Volume from point clouds – through to the quantity report
Fill and cut between two terrain states, with a traceable calculation grid, selectable sources and a PDF report you can hand on.
The problem: a number that has to be checked
Quantities from point clouds are only as reliable as their basis: which points count as ground, how large is the grid cell, which surface serves as reference? Pointcloud Manager shows these bases on the card of each volume, recalculates after every change and keeps the result as a shape in the list.
How it works
Classic volume over a reference
With the “Volume” tool you draw a polygon. The volume is calculated against a reference, either a plane or a terrain-following TIN surface from the polygon edge. The card distinguishes stockpile, pit and net. The calculation uses the same reference and cell size as the card.
Volume A/B: before and after
The “Volume A/B” tool calculates fill and cut between two surfaces inside a drawn polygon. The card has two rows: “Reference (before)”, for example the original ground, and “Comparison (after)”, the new ground. If the comparison is lower, that is cut; if higher, fill; net = fill − cut. Slot A as reference and slot B as comparison are the defaults.
As a source you choose per row a point cloud (slot A or B), the active terrain model, a horizontal plane at a fixed height or a “constructed surface (TIN)” from layers, for example formation and slope lines. The slot shift is taken into account. In the viewport each counted grid cell shows a column between the two surfaces.
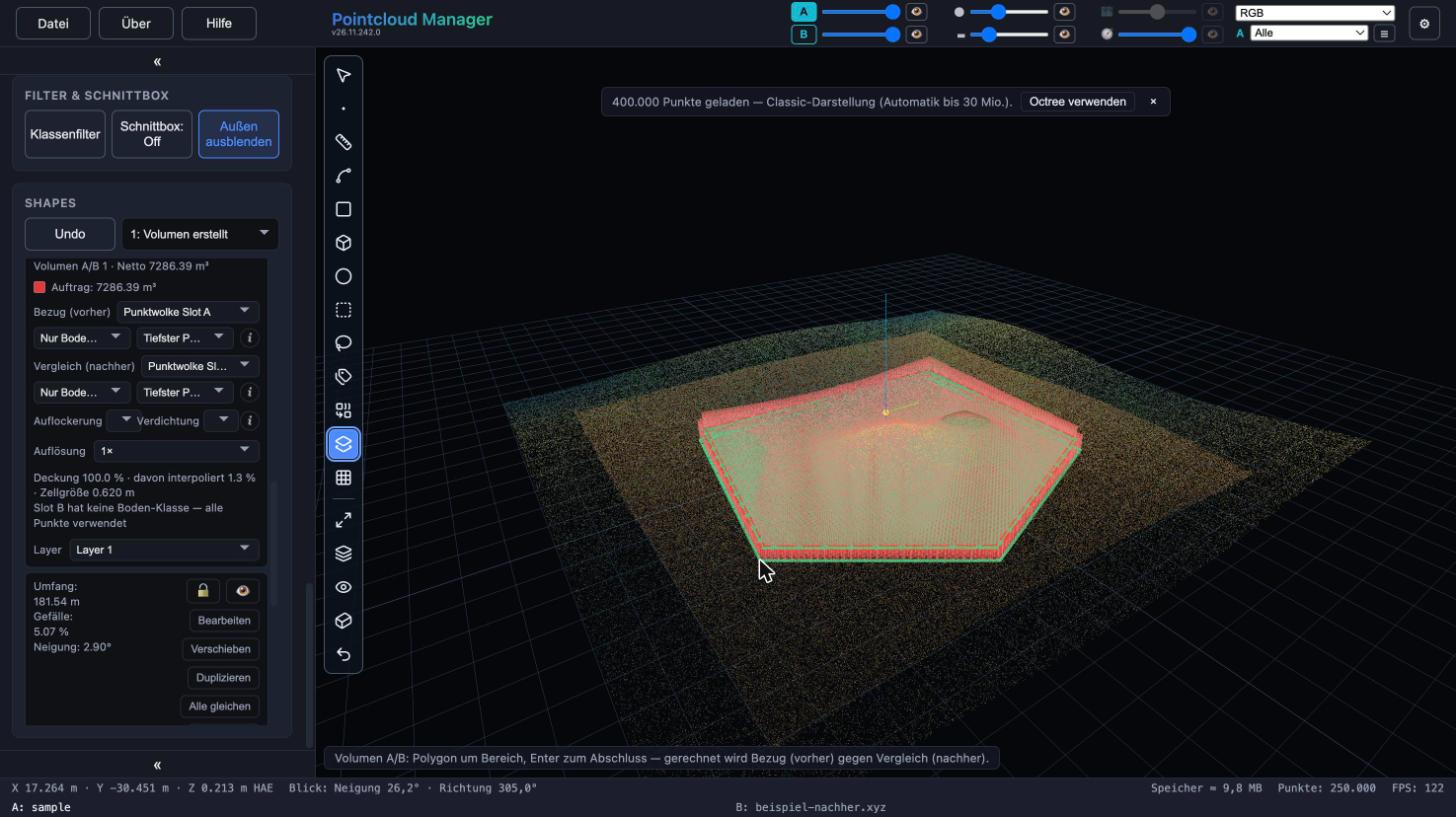
Volume A/B shape with columns in the viewport and card with reference, comparison and net in the shape list. Sample data, German interface. Set the calculation method
For a point cloud you choose “Ground only (class 2)” or “All points” and, per grid cell, “Mean” or “Lowest point”. The default is the lowest point per cell because it is robust against stray points above the ground (vegetation, people); a mean would lift them. Resolution 1×, 2× or 4× refines the grid: 1× uses an automatic cell size from the point density (about nine points per cell), never below 0.05 m. The hint line states coverage, the share of filled holes and the cell size; if individual cells deviate strongly, the card reports probable stray points.
Bulking and compaction
Two fields below the number take the bulking factor (loose volume per solid volume of cut) and the compaction factor (volume to deliver per solid volume of fill), each from 0.5 to 3. With a factor other than 1, “Haul-off, loose” and “Fill demand” appear. The app knows no soil properties; the factors are your input. The measured numbers for cut, fill and net stay unchanged.
Quantity report as PDF
Under File → Export → “Quantity report (PDF)…” you select the volumes (Volume A/B and classic volumes together). The report contains a table with area, cut, fill and net per volume, a total row, optionally a site plan on a round standard scale (for example 1:500) with numbered markers, north arrow, scale bar and the scale stated in the PDF, a views page with four views, and a page with the basis of each volume (layer, reference, comparison, cell size, method, notes). The site plan is captured anew from the cloud, not taken from the screen. The header states title, date, author, project and the coordinate and height systems; quantities follow the display unit (meters, feet or US feet).
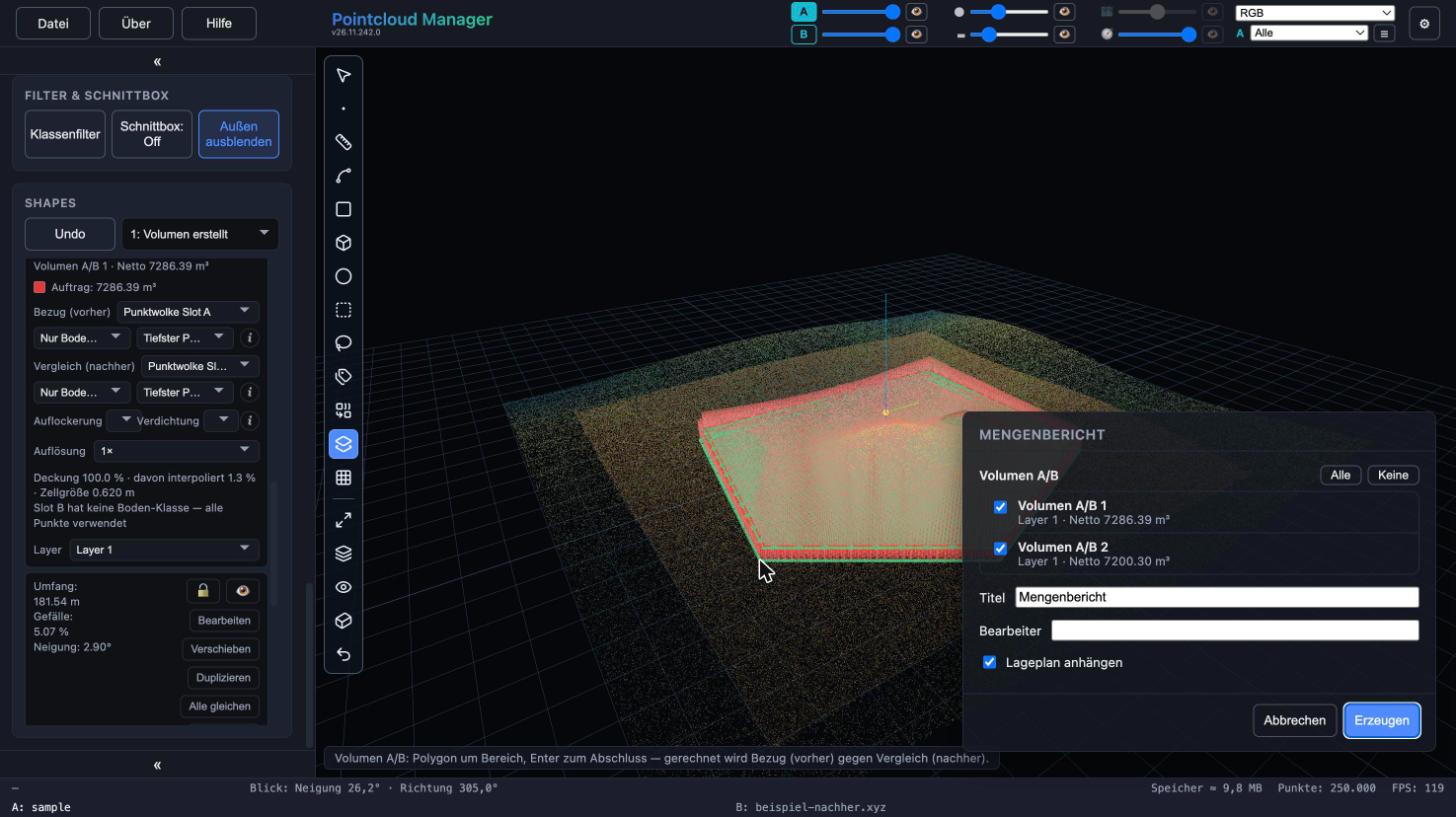
Quantity report dialog with two Volume A/B entries, title, author and site plan option. Sample data, German interface. Next: slope and cross sections
Around a formation level, “Create slope” builds a slope with two gradients and intersects it with the terrain; optionally a Volume A/B is created with it. “Cross sections” calculate fill and cut along an axis using the profile method – a second, independent way of calculating alongside the grid – and can be included in the quantity report.
Result
Fill, cut and net per volume, 3D columns for a visual check and a PDF with table, total, site plan and basis. The result is always current: it is recalculated after drawing, after every vertex drag and after every change on the card. The settings are saved, not the numbers.
Limits
- The accuracy of the numbers is that of the method: grid cell, chosen sources and reference surface. The card’s hint line states the cell size and the share of interpolated cells.
- A terrain model from a slot with a shift or alignment still open is refused, as are two surfaces in different coordinate frames and an empty slot. The card then shows the reason instead of a number.
- The quantity report is a snapshot and is not saved in the project. The total row is formed from unrounded values, so the individual values shown do not always add up exactly to it.
- The scale bar in the site plan is only correct when printed at original size. Characters outside the PDF standard character set appear as “?”, and there are no labels in the site plan.
More in the manual
The complete description of the functions used is in the manual:
Status: app version 26.11.242.0
More features
Work with your own point cloud.
Open point clouds, trace existing features and export geometry for CAD — directly in your browser, with point cloud data processed locally.
Try free for 14 daysRequest a demo